Free Resource
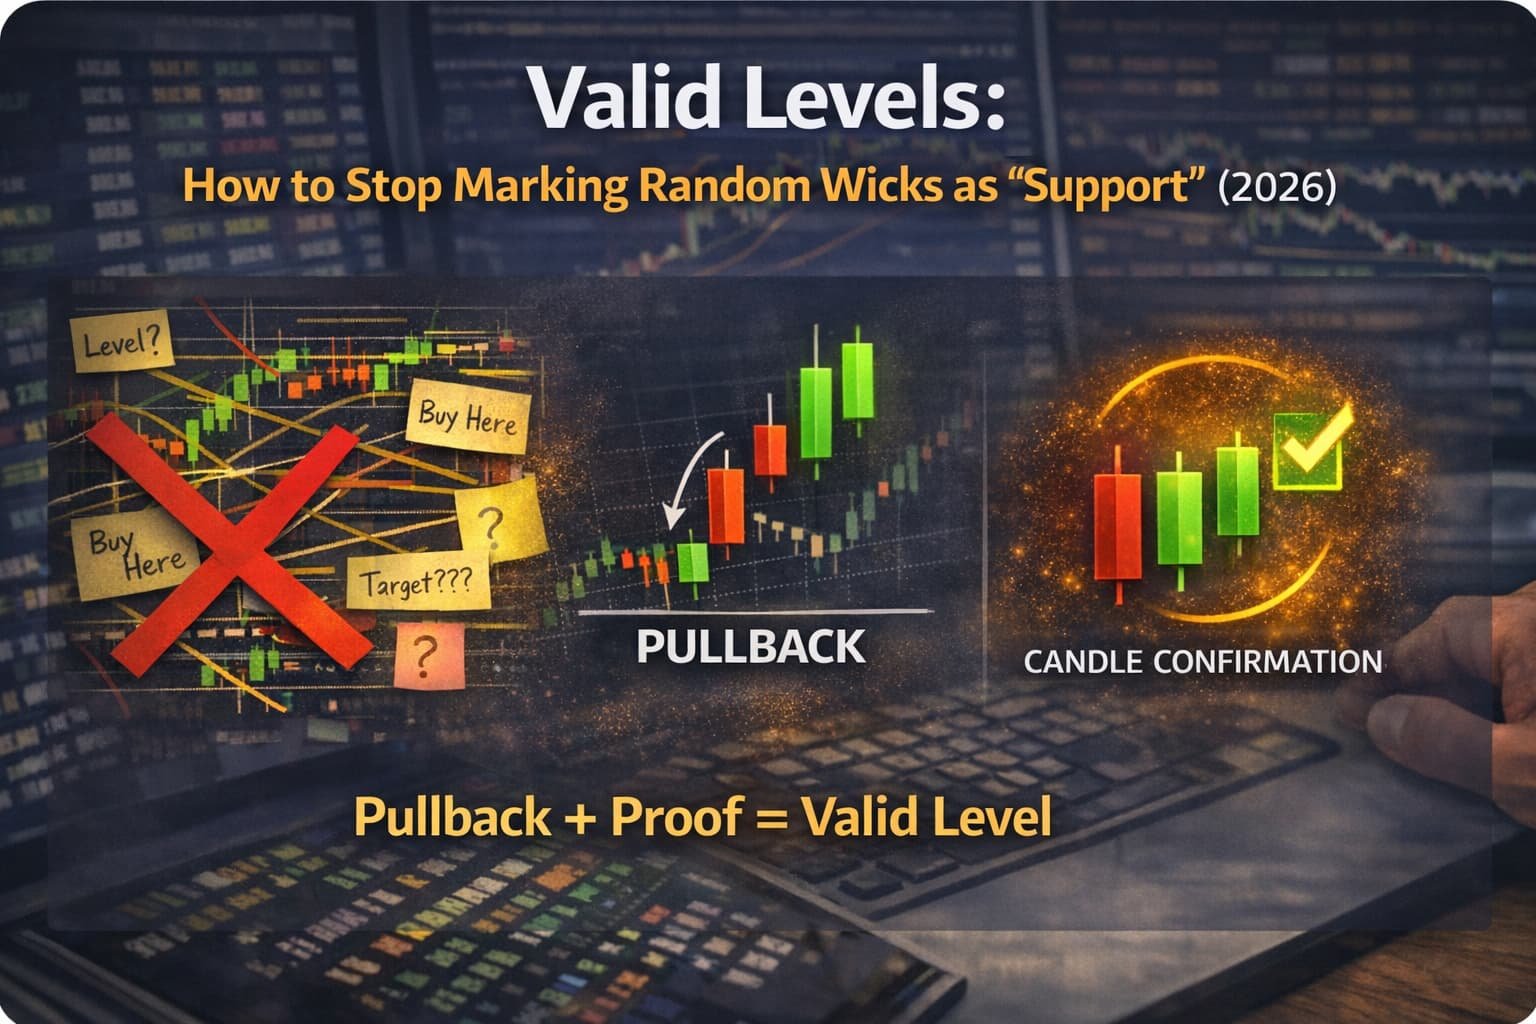
Valid Levels: How to Stop Marking Random Wicks as “Support”
If your chart looks like a spider tried to do technical analysis, you already know the pain:
You mark a “level.”
Price touches it.
You enter.
You get stopped.
Then price respects it… two candles later… without you.
So you add more lines. Then you add more “zones.”
Now your chart is a crime scene and your decisions get slower and worse.
This post is about how to identify valid trading levels using a simple smart-money logic:
A level is not a swing. A level is a swing with proof.
Names don’t matter. Candle colors don’t matter. Logic matters.
What a “level” actually is (and what it isn’t)
Most traders treat levels like a visual illusion:
- “This wick looks important.”
- “Price bounced here once.”
- “This area feels strong.”
That’s how you become a professional line-drawer.
A valid level is a price area that has two structural features:
- Pullback happened (trend failed to continue smoothly)
- Candle confirmation happened (the level has actual “structure,” not a single hiccup)
If one of those is missing, it’s not a level.
It’s just price existing.
Step 0: Stop obsessing over candle color
Here’s the weird part that people hate:
Color is not the core signal. Range is.
Your “candle range” is:
High wick → Low wick
Not “close.” Not “body.” The full range.
Why? Because structure is built on where price explored, not just where it settled.
So when we say “trend continues,” we mean:
- Uptrend: each new candle can print a higher range
- Downtrend: each new candle can print a lower range
Feature #1: Pullback (the first sign a level might exist)
A pullback is simple:
In an uptrend, price keeps printing higher ranges… until it doesn’t.
The moment a candle prints a lower range than the last valid one, you’ve got a pullback.
In a downtrend, price keeps printing lower ranges… until it doesn’t.
The moment a candle prints a higher range, that’s your pullback.
That’s it. No magic.
Pullback = the first structural “pause” in continuation.
But here’s the important part:
Pullback alone doesn’t create a valid level.
Pullback just tells you “something changed.”
Feature #2: Candle Count (the part most people ignore)
This is where traders embarrass themselves.
They see a pullback and instantly declare:
“Support.” “Resistance.” “Order block.” “Institutional level.”
Calm down.
A level needs structure, and structure needs repetition.
The clean rule
After pullback, you need candle count to confirm it’s a real level.
There are two common valid ways:
- Two same-direction candles in a row (the basic version)
- If it’s a single-candle pullback, then you need three candle bodies closing inside that candle’s range
That second rule matters because single-candle pullbacks happen constantly and most of them are worthless.
So you force the market to prove it’s actually accepting that range.
If the market can’t hold and build inside the range, your “level” is just noise.
The “invalid candle” trap that wipes people out
Sometimes you’ll see a candle that fails to print a new extreme.
It’s basically the market hesitating.
If the next candle breaks the “invalid” candle’s range, that is not enough to confirm a pullback.
The market might just be consolidating.
For pullback to count, price must break the range of the last valid candle, not the random weak candle.
This is where a lot of “I was right but got stopped” stories come from.
You weren’t right. You were early.
The simple model: Valid Level = Pullback + Proof
Here’s the logic you should actually run:
- Find the last candle that printed the extreme (last valid candle).
- Confirm pullback by a candle printing a range the other way.
- Then demand candle count confirmation.
If you skip the proof step, you’re marking levels like a fortune teller.
The upgrade: What makes a level “high quality”
Even if you get pullback + candle count, not all levels are equal.
A stronger level usually has one extra behavior:
The new level “sweeps” the previous pullback area.
Meaning: the market grabs liquidity from the prior pullback before continuing.
That sweep is basically the market saying:
“Let me take the obvious stops first, then move.”
If your new level cannot even touch/sweep the prior pullback zone, it’s often weaker.
So the higher-quality level logic looks like:
Pullback → Structure builds → Sweep prior pullback → Continuation
That’s the kind of level that behaves like real participation, not random bounce.
What “looks like a level” but isn’t (common trash)
Even with perfect candle behavior, sometimes it’s still a pass.
A “valid level” becomes not worth trading when:
- It forms inside tight consolidation (rotational chop)
- Price keeps closing deep inside the origin zone repeatedly (weak defense)
- Your target sits directly into obvious nearby liquidity (you’re trading into a wall)
- The whole thing is happening in dead liquidity hours (the market is just drifting)
You’re not trying to prove “levels work.”
You’re trying to trade levels that behave like continuation, not like a coin flip.
Practical checklist: Marking valid levels without lying to yourself
Before you draw anything, ask:
- Do I have a clear directional push (up or down)?
- Did a real pullback occur (range broke the other way)?
- Did candle count confirm acceptance? (2 in a row or 3 closes inside range)
- Did price sweep a prior pullback zone (extra quality)?
- Is this level forming in clean structure, not mid-range chop?
- Is liquidity present (session matters)?
If you can’t answer those, don’t mark it.
Yes, that means fewer “opportunities.”
That’s the point.
How to practice this without turning it into a religion
Pick one chart. One timeframe (like 5m). One session (London/NY).
Then do this for 20 minutes daily:
- Identify the last valid extreme candle
- Find the pullback trigger candle
- Confirm candle count proof
- Mark the level as a zone (not a single line)
- Track whether price respects it cleanly or chops through it
After a week, your chart will stop looking like modern art.
Closing thought
Valid levels aren’t rare.
You just bury them under 200 fake ones because humans can’t resist drawing stuff.
A level is not a place where price moved.
A level is a place where price moved, paused, proved acceptance, and built structure.
If you keep treating every wiggle like a “key level,” you’ll keep getting the results you clearly enjoy suffering through.